


I've been monitoring the finances of our association since 2001, before I purchased here.
Over that time, I've constructed quite a few spreadsheets and charts, using the publicly available data. I began monitoring several ongoing projects in 2008. These include our roofing and driveway projects. This diligence on my part resulted in a letter to my fellow owners in September 2010.
This post explains how I went about determining the possible costs of our roofing project over a possible schedule. Since October 1 I have updated this information and provided it, with a number of other charts, for our board's use in the budgeting process and workshops for planning 2011, and the near future (5 years or so). I did so, because I am now a member of the board of managers and it is both my duty and responsibility to prepare such information, and to provide it to the board, so that we may make the necessary decisions. (Note 1).
This chart, for our roofing project, is a "scenario" which is an approximation, an illustration. It is realistic, and uses possible numbers and dates, but it is not "our" chart, because this chart assumes certain budgeting and spending may occur. It may not. That is entirely the choice of the board, of which I am but one. (Note 2).
However, this chart is useful to you, because it does provide useful information.
I have recently prepared new charts and spreadsheets on funding, costs and scheduling, using "real" and "projected" budgeting information, including association data provided by management to the entire board. These charts, which are similar to the ones posted here, and some additional spreadsheet data, have been issued to the entire board. Those charts include:
- Paving - Driveways, 2010-2017
- Roofs, 2010-2017
- Garage Floors, 2011-2019 and beyond.
- Summary - Roofs, Driveways, Garage floors and Masonry, 2010-2019
- Reserve Balance, by category, 12/31/2010.
- Reserve Fees collected, by category, 2010-2020 and beyond (Note 3).
- Estimated cost per unit (e.g. per roof, per square foot of driveway, etc.).
- Estimated annual cost increases, due to inflation in materials and labor.
- Estimated return on reserve savings (CD rates, etc,).
- Estimated progress dates (e.g. driveways to be completed in 2011, 2012, 2013, 2014, etc.)
Here's a first chart. It indicates a reasonable schedule, by year, for the replacement of roofs at BLMH. It includes the number of roofs completed per year, and the number of roofs remaining to be completed. This is just an estimate, and an illustration. It shows that the final roofs will be completed in 2016. The actual schedule will be determined by the board with the recommendations of management:

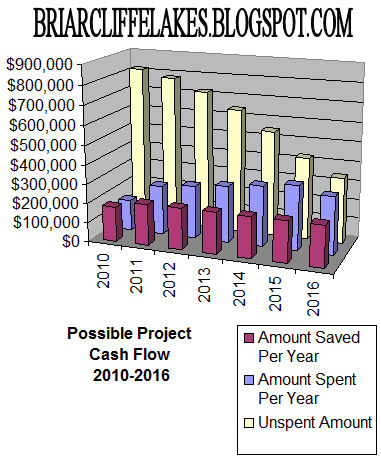
The next chart, shows a possible funding of the roofing project, accomplished at the schedule in the chart above. All roofs would be completed by 2017. The chart begins with a hypothetical balance in the "roofing reserve" account in 2010.
Each year has three columns. The front most is the amount added from our fees and accumulated interest on savings, to the "roofing reserve" account each year. The middle column is the amount spent each year, to accomplish roofing on the schedule. The rear column shows the amount remaining in the "roofing reserve" account on December 31 of each year, after paying for the roofs completed in that year.
At the end of the project, in 2017, the reserves are about $300,000. Why is that? Well, that roof installed in 2005 may need to be replaced 15 years after installation; experts have stated that shingles on roofs in our area may require re-shingling in as little as 12 years. We also know, from experience, that they may last quite a few years longer (Note 4). So, that roof completed in 2005 may require re-roofing in 2017. Roofs completed in 2009 may require re-roofing in 2021, etc. So, the board, in fulfilling it's duty to provide reasonable funds for the operation and maintenance of the association, must begin funding for those roofing projects with a possible beginning in 6-7 years. In 2017 a new roof with gutters may cost $55,000 each! (Note 5).
Comments, Corrections, Omissions, References, Miscellaneous News
Note 1. At present, my reasons for preparing these various spread sheets is as dictated by my fiduciary duty, and that of my fellow board members. That duty, among other things, "relates to a director’s responsibility to perform his duties in good faith, in a manner each director believes to be in the best interest of the association, and with such care, including reasonable inquiry, as a prudent person in a like position would ordinarily use under similar circumstances."
Note 2. I have adjusted the data slightly for this "illustration." The original charts were prepared with association information and information provided by management to the entire board. The originals also had accompanying numbers for starting reserves amount, fees collected per year, actual roofing costs and funds spent on roofs per year, etc.
Note 3. The necessity of project timelines was determined by the possible duration of the project. For roofs, it was easy, because the condition of our roofs is well known; our boards have been accumulating funds for about 6-10 years for this purpose. Some projects are longer in duration. For example, several garage slabs need to be replaced. Experts have stated to the association that concrete will last 50 years. Of course, that doesn't mean that all of our garages will "vaporize" and crumble to dust in 2028 when most are 50 years of age. What it does mean, is we can expect, as an association, to repair or replace many of them over the next 17 years. That includes several which should be replaced immediately, in 2010 or 2011. There will be more.
Note 4. Of course, it's not possible to time these projects perfectly. Delaying a project and then attempting to do any roof in the year prior to failure is not possible. It would be foolhardy to attempt such guesswork. On the other hand, as I posted here, earlier, if this association habitually does the roofs one year early, over a projected life of 100 years, we'll spend an estimated additional $420,000!
Note 5. Because of inflation, roofs are expected to cost more in 2015 than they did in 2010. For this illustration, I used a starting price for roofs in 2010. That was adjusted annually, by an amount based on likely increases in the cost of shingles, etc. Our roofs are approaching the end of useful life. That's why we have a re-shingling project! About 40% of our roofs have shingles that are 15 years of age. In 2009 and 2010, roofs were re-shingled which had the following ages. The average age of the shingles on the replaced roofs was 14 years:
- Installed 1992, re-shingled 2010 = age 18 years.
- Installed 1993, re-shingled 2010 = age 17 years.
- Installed 1996, re-shingled 2010 = age 14 years.
- Installed 1996, re-shingled 2010 = age 14 years.
- Installed 1998, re-shingled 2009 = age 11 years.
- Installed 2000, re-shingled 2010 = age 10 years.
No comments:
Post a Comment
Please leave a comment!
Note: Only a member of this blog may post a comment.