Updated Surplus Numbers

Updated Surplus Numbers
Updated Surplus Numbers: Actual surplus 2018 per audit was $85,163.
Boards 2011-2018 implemented policies and procedures with specific goals:
stabilize owner fees, achieve maintenance objectives and achieve annual budget surpluses.
Any surplus was retained by the association.
The board elected in fall 2018 decided to increase owner fees, even in view of a large potential surplus

Average fees prior to 2019

Average fees prior to 2019
Average fees per owner prior to 2019:
RED indicates the consequences had boards continued the fee policies prior to 2010,
BLUE indicates actual fees. These moderated when better policies and financial controls were put in place by boards

Better budgeting could have resulted in lower fees

Better budgeting could have resulted in lower fees
Better budgeting could have resulted in lower fees:
RED line = actual fees enacted by boards,
BLUE line = alternate, fees, ultimately lower with same association income lower had
boards used better financial controls and focused on long term fee stability

Saturday, December 3, 2022

Final Post - We sold our condo

0 comments


Our condo

Bookmark and Share

Several years ago we decided to sell our condo.  We had two options:  Rent it or Sell it.  BLMH by-laws permit rentals.  However, we decided we didn't want to do that.  Furthermore, we didn't want to sell it to an investor.

Circumstances intervened, including the CCP Covid-19 pandemic. So our plans were delayed several years.  We had established places to live in two other states because we are RVers.  So, the condo sat fallow most of the year.

In 2020 I decided it was time to permanently close my business, and I went through the office furniture, etc. and cleared it out.  In the fall of 2020 we spent some time on the east coast.  That delayed preparing the condo for sale. Then winter set in and we headed to the Southwest. In June 2021 we rented a U-Haul and took some choice pieces of furniture to our winter location.   Upon return to Wheaton we helped a neighbor move. Then winter set in and we headed to the Southwest.

Finally, in spring 2022 we began prepping the condo for sale.  Residuals from my business were disposed of. 

In June and July I emptied the home office.  I scanned old documents and photos and tossed the originals.  A professional service shredded documents and hard drives. 

There were a number of minor repairs to do, and these were completed in July, August and September, while we pared our belongings. 

We gave a lot away to Amvets and Goodwill.  The condo was ready for staging in early October and the condo was placed on the market on October 6.  We immediately got several offers from investors, but we noted issues with the contracts.   

A short time later an individual buyer made an offer and we accepted.

The closing was scheduled for late November, early December and has been sold.

Good-Bye to Illinois. 


Monday, December 27, 2021

Projects reports to Boards and to owners

0 comments


Project costs of 2018,
presented to owners during the 2018 Annual Meeting

Bookmark and Share

Project reports to the HOA owners and the board are useful.  It is important to track expenditures but in my experience, boards at BLMH didn't do a good job of tracking the actual long term project costs.  There are a variety of reasons to do so, including the building of better budgets and the preparation of owners for positions on the board.

Of course, this information must also be responsibly communicated.

I prepared a variety of spreadsheets and charts as a member of the board 2010-2018.  This is one in a continuing series on the benefits of doing this.  Owners get better insights, and the board can make better decisions, if they choose to do so.  See Notes 1, 2, 3 and 4 as an example.

The chart above was presented to owners during the September 2018 annual meeting.  That was my final meeting as a board member. (Note 1).

When I was a board member, I created spreadsheets as condition reports and surveys to present to the board so the board could properly perform its fiduciary duties and maintain the property. I also created spreadsheets to track project expenditures as the board voted to perform that maintenance.  To be clear about this, Management did provide this information in a different form and presentation to the board each month via the monthly "Information Packet".  However, my goal was improved communications and better board decisions.  The board's decision to replace management effective January 1 means I can't say anything about the future.

In 2018 I made a sheet and presented it during the annual meeting, so owners could see where the board was spending the reserves.  I did similar sheets for a variety of projects completed or undertaken during previous years.  I was on the board for eight years and millions of dollars were spent on roofs, drainage, streets, water mains & fire hydrants, driveways, garage floors, streams, common decks, unit patios & property bridges & decks, tree removal and replacements, and so on.  

I do have a very good idea of how much was spent and where.   How is that?  Because I paid attention and kept notes and made spreadsheets.  The chart below is an indicator.  I held a variety of positions over an eight year period, including Maintenance, Architecture directors, and president. I made it a point that that these financial insights were all thoroughly discussed.  Owners, who are the shareholders of this not-for-profit corporation, were informed during meetings and via the newsletters. 

There is no requirement that owners attend association meetings, although I also made it a point as a board member to promote that they do, and I rewarded those who did with informative meetings. 

As an example, I included the chart above as part of presentations to the board and to the owners during a regularly scheduled meeting and I telegraphed it via the newsletter.  I would have included more and at times I even expended the pages in the newsletter to provide additional information.  

Not all board members agreed, and some remain on the board to this very day. Since 2019 that has been reflected in the newsletter and in the termination of the BLMH.org website by the board in 2021.

Even the "Welcome Packet" was allowed to wither by non-supportive board members. It hasn't been updated, nor is it available online.

(C) N. Retzke 2021


Sunday, December 12, 2021

Patio Condition Survey

0 comments


Patio Survey - My Spreadsheet September 2012
Survey by our Manager and I.
Presented to the board in September 2012

Bookmark and Share

After I joined the board in September 2010, I initiated a lot of onsite surveys.  These were a necessity because the board was unaware of the condition of much of the infrastructure.  The earlier board had left in September 2010 but did not turn over condition reports to the new board; I suspected there were none.  Management provided whatever they had and that became the beginning of regular, annual surveys from 2011-2018.

I did the survey, for some of them management joined me, and for others another board member joined me.  

The need for these surveys became apparent when several owners approached the board in September 2010 and reported issues with garage floors. The board considered a repair, but I asked if we had a list of the condition of the 84 garage floors on the property.  We didn't.  I asked the board to delay a replacement until a proper survey could be made.  The board agreed.  

The garage floor condition survey was conducted in early 2011 and was reported to owners in the May-June 2011 Newsletter.  That survey revealed eleven garage floors in "poor" condition. The article is available by clicking here:

May-June 2011 Newsletter - Garage Floor Survey

To avoid any confrontations, I would never do garage or patio surveys unless accompanied.  

Patio Survey

The garage floor survey was the first of many, regularly scheduled annual surveys. 

The patio survey in the image above was submitted to the board in September, 2012.  One board member, who had been on boards for a couple of decades contested my findings.  It was her position that earlier boards believed that they had repaired all of the patios.  The facts and owner statements disproved that.

I conducted a formal survey because I observed some patio issues during my normal walk-arounds on the association property.

All of these surveys had the intention of best directing maintenance resources and avoiding breakdowns.  All resources were paid for by owner fees, and breakdowns would be at a minimum an inconvenience for owners, and at worst, require higher repair costs.  Higher costs result in higher fees.


(c) N. Retzke 2021

Sunday, November 28, 2021

Streams Project

0 comments


Waterfall #2, new walk and bridge - partially completed status in 2014

Bookmark and Share

In 2010 the HOA Board decided that the streams at this condo association were to be maintained, reversing two decades of decline.  The streams are an important architectural feature of this homeowners association. This video indicates project highlights, which required 6 years and included decks, bridges, 3-manmade streams, pump pits, pressurized water lines, and the installation of retaining walls and numerous concrete repairs. I led this long term project, and the replacement of 500 feet of water mains, a major street, replacement of 26 large roofs 2011-2014, 60 driveways and numerous garage floors as well as drainage and lawn improvements 2011-2018.

The decision made in 2010 was made at a time that owners were struggling with the consequences of the banking disaster of 2008, and the recession of 2007.  There were foreclosures and delinquencies.  The board had to answer the question "Do we need to implement a cost reduction program?" and "How to go about reducing costs?"

One item discussed was the streams.  These are man-made, two were in poor condition and all use city water at HOA expense.  Shutting them down would reduce maintenance and utility costs. On the other hand, they couldn't simply be abandoned.  The board would have to come up with a plan to remove them.

Here's the owner delinquency situation.  At the time of these discussions the delinquent amounts were spiking:

Delinquency Amounts 2008-2018

The board in fall of 2010 decided to maintain the streams and replace a failed pump. At the time, I told the board this decision would have long term consequences and as a board member I set about designing a program to restore the streams and reduce water consumption.

The program needed to wait until the roofing project was completed.  We also needed to address serious problems with Lakecliffe, a street which was failing.  Most driveways needed to be replaced and numerous garage floors had issues.

It took a number of years to complete the project envisioned in 2011, and the significant steps were completed in 2018.


A 15 minute YouTube video:

https://youtu.be/6-hM55JWLzs

Notes:

  1. The man-made streams consist of an elevated waterfall and concrete bowl.  Water flows downhill from the bowl, via manmade streams to a crushed stone pond.  At the pond a pump, buried in a pit, pushes the water back to the waterfall via a buried pipe.  The elevated, concrete bowl is built above a layer of clay.  Cracks in the bowl allow water to escape into the soil, below.  The water migrates through the soil, flowing downward until it reaches clay, which is a barrier impervious to water. Upon reaching the layer of buried clay, the water continues to flow downhill along the surface of the clay.  At Stream #3 that flow is toward Lake #4. Decades ago, a wall was constructed adjacent to a building and drain tiles and crushed stone installed to divert water around the building, with limited success. Additional work on that drainage system was included as part of the streams project.
  2. Actual annual operating costs include water and electricity for the pumps. Water is required to initially fill the streams and water replenishes that lost via leaks.  The ponds can and do overflow particularly during rainfall.  The property is not level and has about 15 acres of turf. Rain water and snow melt flows from roofs and will find its way to some of the streams. This can exceed the capacity of the ponds. (See photos, Note 15).
  3. During warm weather the waterfall pumps must operate continuously.  If the pumps stop, the streams will empty.  They must then be recharged with costly city water.
  4. The stream water pumping systems are maintenance items and can failure. Because the pumps run continuously for about 6 months each year, a pump will wear and will require maintenance after 3-4 years.  The water lines to the waterfall are under pressure and these can and do fail.  The line for Stream #1 did and a major section was replaced in 2018. The pump pits were installed in 1978. These were galvanized steel.  These rusted and failed, allowing water and mud to fill the pits, burying the pumps and making pump maintenance costly and difficult.  During the stream project all of the pump pits were replaced with heavy duty plastic double walled cylinders suitable for direct burial. Other mechanical improvements were made to reduce the labor required to maintain the pumps and pits.
  5. During the work on the streams, waterfalls and ponds, a lot of grading occurred to direct the flow of seeping water away from buildings.  Such water can undermine concrete patios and building foundations. Additional direct burial piping was installed to direct such flow to storm sewers and to streams.
  6. The bowl for Waterfall #1 was replaced.  Repairs were made to the bowl for Waterfall #2.  It is likely additional work will be necessary on the waterfall bowls, in particular at Waterfall #3 if the seeping of water through cracks is to be further reduced. 
  7. The streams project was delayed by other, more urgent and expensive projects. The overall state of association infrastructure was "disrepair" as of 2010.  The stream project required detailed cost analysis.  The reserve studies of 2010, 2011 and 2015 were helpful. G& D Management and the contractor who did the work were essential, as were the maintenance company.  It was necessary to identify issues, determine solutions and costs. Concrete technology has advanced and we used a concrete for parts of the project that included strong fibers dispersed throughout the mix. The additional cost of this advanced concrete was minor. 
  8. It was a goal to reduce operating costs.  These costs include labor to maintain and repair, water consumed and electricity. This project is not complete.  My plans and notes are included in seven boxes of documents, drawings, sketches and notes I accumulated 2011-2018.  Some board members had little interest in this information. It will be shredded and will vanish, as did the years of Newsletters the boards of 2019-2021 deleted from the official association website.
  9. Some board members have preferred splashy, expensive landscaping projects at the ponds, rather than maintaining the system. Such eye candy should only be done after the maintenance is done. For years it wasn't.  The Landscaper promoted these expensive and profitable projects, the owners appreciated the eye candy and re-elected those boards. Shrewd board members, interested in re-election accommodated.  However, this deferred needed maintenance, ultimately contributing to the demise of the stream system and higher costs and owner fees.
  10. The waterfall and pond of Stream #3 was found to be in the best condition. A large deck had been installed earlier (in the 1990s?). However, thereafter the other stream systems were ignored, or maintenance suspended and relegated to patching small problems.
  11. The stream project began in 2013 with the identification of sub-projects and phases of the work.  Actual concrete work began in 2014. A portion of stream #1 between Thames and Lakecliffe was repaired. That section, from the gazebo to the pond was muck.  It was dug out, a layer of clay placed, then a liner and crushed stone above.  The gazebo which was rotting was removed. It was planned to install solar shales, but one board member wanted wood.  So nothing happened. 
    Commercial quality solar sails
    Photo from Newsletter July-August 2017

  12. In 2014 an engineering study of the streets provided sufficient information to determine a course for action in dealing with the failing streets.  The street project would occur 2014-2022 if the boards agreed. Lakecliffe, Salisbury were replaced 2014-2018 with patching of Dover, Harrow, etc.  Significant work remained for 2019-2022. In the spring of 2015, an updated survey of the streams was conducted with management. The completion of Lakecliffe and Salisbury streets were anticipated and in 2015 a schedule was created for completing or patching the remaining streets.
  13. I videotaped the stream survey and presented it to the board. We discussed the scope of the work and I proceeded with detailed planning.  That videotape is incorporated in the YouTube video and in included in its entirety.
  14. During the period 2013-2018 significant repairs were made to the water mains on the property.  Several fire hydrants were replaced, several B-valve shutoffs were replaced, and about 500 lineal feet of water mains were replaced.  This too had to be balanced with all of the other maintenance projects.
  15. Not all board members were supportive of these efforts.  Special thanks to the President 2012-2015, and the Treasurer and Maintenance Director who departed the board in the fall of 2018.  They were the prime motive force to accomplish many of the projects at BLMH.
  16.      


    One year after I had this retaining wall put in,
    the board voted to hire a landscaper to replace it with large slabs at great cost!


(c) N. Retzke 2021


Tuesday, November 23, 2021

Failing and Failed Streets - Ultimately a failure by boards?

0 comments


When a street fails and the stone base is damaged,
complete replacement becomes necessary.
This includes portions of the stone base, as well as all layers of asphalt. 
It may also require curb and basin repairs or replacement.
It is expensive.

Bookmark and Share

The Notes are an important part of this post.  Three or more of the current board members participated on boards 2012-2018, made decisions or were present when they were made, and they experienced what is depicted in the photos (Note 5).  

For more posts about street repairs, go to Note 10

This post is a case study and I use the streets of the association as an example. 

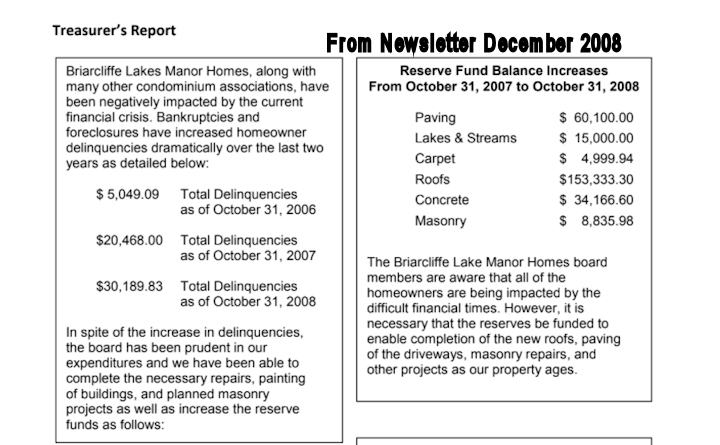
A lot of association money, which is to say, owner fees, has been spent repairing and replacing streets at BLMH since 2002.  In fact, streets installed at great cost during 2002-2003 showed signs of premature failure in 2007.  (Note 6). That was one of my motivations to join the board. It has been my position that owners can ill afford the fees required to deal with premature failures of major projects, which are a consequence of board and contractor failures.

Boards will argue that they aren't professionals.  Considering the size and age of the association, my position has been:

  1. We need capable professionals on the board. 
  2. We need more skillful and capable boards.
  3. Board members should be aware of their limitations and act accordingly during votes.
  4. Boards must be comprised of individuals who will act as fiduciaries on behalf of all owners. Some board members think they represent and act on behalf of, and in the best interests of, the association, which is a not-for-profit corporation. They don't. They represent the owners who are the shareholders.
I'm a proven, competent professional and I joined the board in September 2010.  I enrolled a Certified Public Accountant to join the board in 2011.  See the "Board Leadership" insert at the end of this post (Note 9).  However, prior leadership and some board members weren't enthusiastic about the changes. In fact, an earlier president once complained during a meeting that "Norm is spending all of the money."  That was a distortion because all undertakings were via vote of the entire board.  Directives were then issued to management.  Some board members decided to stonewall and delay.   As a consequence capable board members left in frustration. The CPA left the board, a maintenance director left, and I left in September 2018. It is no surprise to me that the boards 2019-2022 reverted to earlier methods. 

That reversion is now complete with the decision of the 2022 board to replace of the management company.

Better Methods Achieve Better Results - A Prequel to the Street Projects
By 2008 it was apparent that Lakecliffe, a recently replaced street, was failing prematurely. Significant and extensive patching was required.  Management acknowledged in the July-August, 2013 newsletter that "the [previous] replacement of this street [Lakecliffe] only lasted 5-7 years and required repairs thereafter." (Note 6).

I led the negotiations with the contractor and the association obtained four years of resurfacing and patching at no cost. I couldn't reverse what had occurred, but I could do what was necessary to extend the life of the street so that the roofing project could be completed, other necessary work in the association be done, and plans could be made for a proper replacement. 

As a board member September 2010-September 2018, I pressed the boards to hire competent professional engineers and project engineers to determine the life of the streets and the best means and methods to conduct repairs. The goals included:

  1. Maintain the streets which are vital for resident access.
  2. Spend the fees collected thoughtfully and carefully.
  3. Develop long term programs using facts, data and expert opinions. Avoid guesswork. 
  4. Stabilize fees using better maintenance and financial controls.
  5. Avoid unnecessary delays which exacerbate problems and result in more costly failures.
In fact, one board member suggested during a board meeting in 2013: "Norm, you could prepare the specifications for the streets."   I forcefully declined.  That approach is precisely why our streets failed prematurely.  Instead, I promoted the retention of a professional engineering firm  and a firm to literally dig deeper into the streets to determine the cause of failures using core samples. I enrolled the board to vote do so. Some reluctantly voted "Aye". 

Of course, that meant spending money. Some board members are "penny wise and pound foolish", and remain resistant to this day. Oh, and don't let their professional credentials or professed experience fool you.  It is best to observe them in action and ignore their "Candidates Form" as elections approach. But too few owners are sufficiently motivated to monitor the board.  

Streets Replaced, the Schedule, Owner Communications and Expenditures
In 2013-2015 Lakecliffe and Salisbury were replaced in their entirety with a properly engineered street designed for 20-30 years or more of good life with proper annual maintenance. To achieve this would require crack filling, application of preservative GSB-88 and periodic top layer milling and replacement.  That maintenance has not occurred, but a bid was obtained in 2018 and this was scheduled for 2019.

Professional engineers and project managers were retained over a period of  three years to provide overall guidance and to see that the Lakecliffe street project was properly designed and installed 2013-2015.

Work continued on some of the other streets with less engineering supervision during 2016-2018. This was in accordance with plans provided by the engineers and the reserve studies. All immediate major work was to be completed by 2022. However, boards 2019-2021 disrupted that plan. It is unclear if subsequent repairs will be completed by 2025.

For example, Thames was resurfaced in 2018.  Curb and basin work was done on Harrow and a large section resurfaced 2016-2018. A large section of Dover was resurfaced and asphalt patches were applied on Plymouth. In the year 2018 $102,934 was spent on street repairs.

However, this work is incomplete. In fact, Plymouth, Dover and Harrow were to be completely resurfaced 2019-2022.  Gloucester would be completed by 2025.

Boards were aware of the condition and financial requirements to complete the repairs in a timely manner. (Note 3). There were a number of surveys and professional reports. These were supplemented by surveys conducted by me and our soon to be former managers. 

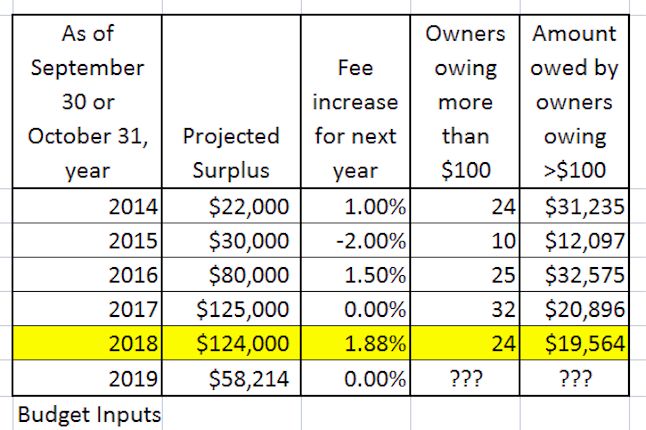
I prepared the following chart. It summarized the situation and projected $229,290 for the initial phase of street repairs in the period 2018-2022.  The 2019-2021 boards included two members who were present for all these discussions and decisions, including the reserve studies. They discussed these charts during association meetings.    (Note 7).


Owners were also made aware. This was a topic in newsletters and board meetings, and I include a link here to the July-August, 2013 newsletter. 


Coincidentally, the 2022 board has voted to replace that management company and that manager. 

Reserve studies commissioned 2010, 2011 and 2015 provided additional financial insights and guidance. Lakecliffe and Salisbury were replaced in 2014-2015, Thames in 2018,  but other streets remained. 

Here is the plan that owners and boards were well aware of:
  1. Sequential expenditures required for remaining street repairs to be completed 2018-2022:  $229,290
  2. Total, possible expenditures for street repairs to be completed 2016-2025: $467,026.
However, delays could be even more costly, and the board members know that.  Anyone who was a resident 2013 to the present day experienced the consequences of previous delays and poor decisions. 

This is a chart presented by me used during the annual meeting held in September 2016.  It provides a 10-year expenditure summary of all major categories using reserves of the association.  To create it I used all of the condition reports, surveys and financial information that was available to all board members

My chart presented to owners during the September, 2016 Annual Meeting
(c) N. Retzke 2016-2021


Delays to Street Repairs increase Costs; coordination issues
I left the board in September 2018, as did the treasurer and maintenance director. This left other experienced board members, two with decades of experience to lead and complete the plans, part of which were outlined in the "Guidance" insert of the August, 2018 Newsletter (Note 8).

Subsequent boards 2019-2021 have failed to complete the initial phase of the program. It is unclear what the board intentions are. 

The problem with delays is that the repairs become more costly as the street base deteriorates. As the stone base deteriorates, the repairs required become more extensive and that drives costs upward. 

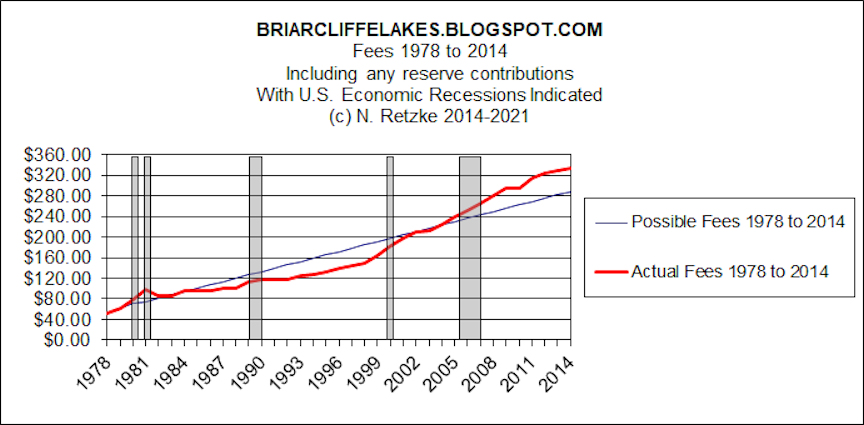
Boards also knew that we have been in a "sweet spot" regarding inflation. Low inflation facilitated repairs at lower cost and saved our owners a lot of money.  That too, has helped to stabilize fees.  But some board members are oblivious.  I suspect the board of 2022 will face higher costs and more resource competition. 

Awareness of such forces was also a motivation in my decisions and those of the presidents, treasurer and maintenance director 2015-2018.  As competition for resources heats up, it becomes more difficult to find and schedule competent contractors.  Resources include competent contractors as well as materials.

Such inflation concerns and potential price increases,  as well as the condition of streams and water consumption was a motivation to do substantial stream repairs in the period 2016-2018.  This work had been delayed to so as to complete the roofing project as well as Lakecliffe and Salisbury street and related water main replacements during the period 2012-2018. Some board members could not understand the urgency and I am convinced they never will. 

So many roofs were completed in 2014 that it was prudent to delay major street repairs. However, street patching continued  while the roofing project was being completed. It was impossible to properly evaluate and manage the street construction and consider the coordination of roofers, pavers, concrete, etc.  There were other repairs underway including walks, driveways, garage floors, stream repairs, basins, curbs, common area bridges and patios and so on. Here's an annual count of the roofs completed while I was Architecture & Maintenance director.  Leak reports and extensive surveys both outside the roofs and inside the attics determined the condition and sequence of replacement:
  • 2011 = 6 roofs (six 8-unit)
  • 2012 = 6 roofs (five 8-unit and one 4-unit)
  • 2013 = 6 roofs (five 8-unit and one 4-unit)
  • 2014 = 8 roofs (eight 8-unit buildings).
  • 2012-2018 drainage work related to all roofs (84 entries and other areas).
The Board Decision Cycle can be an Impediment
I always attempted to determine annual projects during the winter and lock-in board decisions in the first quarter of each year. This allowed the board to obtain bids and get contractor commitments and better prices.  Contractors are motivated to give better prices in the winter or early in the year, so as to build a schedule and establish some certainty for their company and schedule their workers. 

Most boards don't begin annual planning until after the Spring thaw and that is too late in the year to begin.  Consider the board decision cycle which can require many months:
  1. Board discusses projects and alternatives, tables decisions by a month or more. 
  2. Board decides which projects to complete during the current year.
  3. Board directs management to get bids, etc.
  4. Board reviews bids and if necessary gets clarifications.
  5. Board selects the contractors.
  6. Work is finally scheduled. 
Major Expenditures including Streets in 2018
Inflation concerns, pricing and stream condition was a serious motivator to do substantial stream repairs in the period 2016-2018.  This work was delayed so as to complete the roofing project as well as Lakecliffe, Salisbury and  Thames streets and related water main replacements during the period 2013-2018. Some board members could not understand this and I am convinced they never will. 

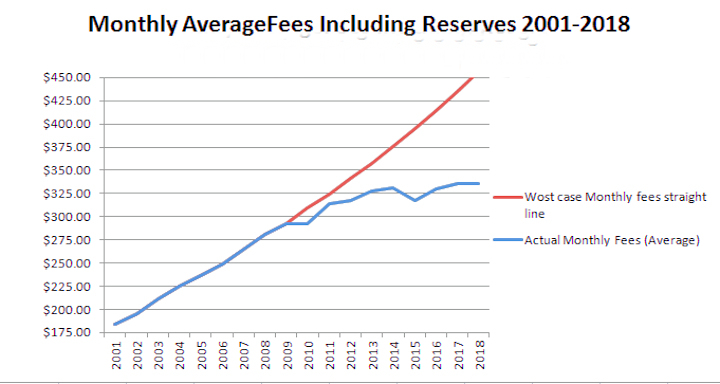
Presented during the 2018 Annual Meeting
I kept owners informed. Image (c) N. Retzke 2018-2021.

Streets Schedule, Additional Information and Being Fully Informed
I prepared and provided additional information to the board and to owners about the status, estimates  and costs of  street repairs. I won't provide detailed spreadsheets here, because they include information that potential bidders would find interesting and might influence future bids.

The boards of 2013-2018 took a lot of steps to be fully informed about the condition, remaining life, and costs and annual expenditures to deal with failed and failing streets.  We made a lot of decisions about streets, including commissioning sophisticated tests to determine why some were in such poor condition and others were failing (Ref: 2013, 2014).  A consulting engineering firm retained for this purpose advised the boards during that period that streets needed to be replaced, and extensive repairs made by 2022.  I've included photos and a table in this post. (Notes 3, 4, 5).

Using professional guidance, extensive street replacement and repairs were made during the period 2012-2018. This phase of the work was supposed to continue and all street asphalt work was to be completed by 2025. This was considered sufficiently important to be an item in my "Guidance" Newsletter insert to owners and future boards in 2018. That was my final newsletter.

The boards of 2019, 2020 and 2021 decided not to do these repairs. Dover, Plymouth and Gloucester show even more checkering today, and whole sections are failing. The board also decided not to apply GSB-88 preservative to Lakecliffe.  That's a proven technique used to extend the life of streets in Wheaton and by other nearby communities. I obtained a proposal in 2018 and it was to have been implemented by the board of 2019.

It is a fact that road deterioration caused by delays to road repairs, including a lack of crack filling, will result in higher replacement costs (Note 2). Higher costs mean higher owner fees.

Spreadsheet Details
There is a spreadsheet behind the chart "Projects 2018 Major Categories". That chart is shown in this post and it uses extensive data.  The spreadsheet included the actual cost for:

  1. Cost of asphalt, curbs and sewer Lakecliffe Project 2015.
  2. Cost of replacement of asphalt and curbs, Lakecliffe Project 2014.
The spreadsheet included the cost of asphalt, curbs and gutters for:
  1. Cost of Thames asphalt, per bid.
  2. Estimated cost for Harrow asphalt work.
  3. Estimated cost of Dover asphalt work.
  4. Estimated cost of Plymouth asphalt work.
  5. Estimated cost of Gloucester asphalt work.
  6. Additional estimated costs of concrete curbs and gutters.
  7. The total cost of all of the above.

To prepare the spreadsheet I included the lineal feet of each roadway, the percent of roadways for each of the streets and extrapolated costs for:

  1. Lakecliffe + Salisbury.
  2. Thames.
  3. Harrow.
  4. Dover. Plymouth. Gloucester.
  5. Total lineal feet of all streets in the Association.

Notes:

Note 1. Three of the 2019-2022 board were present during the annual meeting which included extensive presentations about costs, projects and planned expenditures, Other board member(s) were owners at the time and were also present. Two of the 2019-2022 board members were on the boards for all decisions, votes,  presentations and reports discussed in this post. 

Note 2. Boards in the period 2013-2015 were made fully aware of all of the issues of association roadway factors. This included deterioration, the consequences of delays to repairs, and the potential failure of roadway stone base.  The association hired a professional engineering firm, conducted additional professional tests of all of the Roadways and so on.  All of that information was discussed at length by the boards at the time.  The current board has two members who have decades of experience and were present for all of those discussions, reports and presentations. They were also on the board and present during the entire replacement of Lakecliffe, Salisbury and Thames, and the water mains beneath. Yet, they decided not to do the curb, basin and street repairs and resurfacing of Dover and Plymouth scheduled for 2019 - 2021. Based upon condition, Gloucester could be done as early as 2022.

Note 3. A thorough engineering study of the streets was conducted in 2014. The data in that study was provided to the board and this information was used as part of the decision making process to completely replace Lakecliffe and Salisbury in 2014-2105. It was also used to resurface Thames in 2018, to make extensive repairs to Dover and Harrow Ct. , and to patch Plymouth. Studies recommended additional repairs or complete replacement of Dover, Plymouth and Gloucester.   Only partial repairs have been made to Harrow Ct.

Note 4. Street Survey - My summary spreadsheet of the engineering studies. Note that 5 inches of asphalt is considered the minimum for residential streets per the Consulting Engineering firm that prepared the reports.  BLMH streets had a total asphalt thickness of as little as 2.0 inches:


Note 5. This is what happens
when boards and contractors fail.  I had to clean up the mess in the following photos, which required the entire replacement of Lakecliffe and Salisbury.  Thames was resurfaced and additional, large patches covering entire street sections were done on Dover and Harrow.  The boards 2019-2021 decided to ignore the engineers (the two most senior members of those boards have decades of experience on the board. They were present and voted during all of the street repairs after 2013 and were fully briefed and involved in all street decisions and voting.). 

Checkering leads to holes. That's a yardstick in the photo


Checkering leads to holes - that's a yardstick in the photo


A patch may provide a short-term solution,  but the
problem will spread, damaging the street base


Delaying the replacement of asphalt leads to 
more serious street destruction
which is more expensive to repair

Ultimately, the entire street including all patches will fail,
 because the stone base is damaged, has failed, and cannot
support the asphalt resting upon it.

When a street fails and the base is damaged,
complete replacement becomes necessary.
This includes portions of the stone base, as well as all layers of asphalt. 
It may also require curb and basin repairs.
It is expensive.

Note 6.  FUPM was the property manager during the street work that occurred 2002-2003.  G&D Property Management later replaced FUPM. G&D was the manager during the street replacement project 2010-.

Note 7.  I suggest that the reason boards made expenditures 2010-2018 include earlier board inaction or decisions:
  1. A lack of urgency by long term board members: "We can do it next year, or the next, etc.".
  2. A need to catch-up when avoidance becomes impossible, or owners become angry. Eventually failures of infrastructure can no longer be ignored. Owners wake up.
  3. Board decisions 2002-2005, including the faulty replacement of streets during that period. Most financial resources were allocated to the expensive roofing project which required perhaps $2 million including roofs and associated drainage. 
  4. A failure of boards to perform other timely repairs and maintenance.
  5. A preference of earlier boards to defer and "kick the can down the road" to later boards.
  6. An inability to set meaningful priorities.
  7. Personal agendas.
  8. Putting beliefs ahead of facts.
  9. An desire by board members to maintain personal appearances and to be re-elected.
  10. The age of the association and infrastructure. 
Note 8.  "Guidance" Newsletter insert, August 2018:


Note 9. Board leadership (presidents) 2001-2019:


Note 10. Street Posts in chronological order, oldest first, most recent is last:

Lakecliffe Failure – some Notes:


Lakecliffe Street Engineering Study:
3. Click for: Engineering Study  

Lakecliffe Street Construction – Part 1
4. Click for:  We Aren't Kidding


7. Click for:   This looks Expensive


Lakecliffe Street Construction - Part 2


Lakecliffe Street Construction - Conclusion

Salisbury Street Construction


Thames Street Construction


===
(c) N. Retzke 2021


Saturday, November 20, 2021

Spreadsheets, Charts and Graphs - Operations & Maintenance (O&M) Budgets

0 comments


Comparison, approved O&M budgets 2011-2018
and projected year end budgets.
If the "Projected Year End" is less than the "Approved budget", 
then a board has spent less than the fees collected, and a surplus was created.
Better controls = better and more stable budgets
Caveat: Kicking the can down the road, an old favorite technique
of boards prior to 2010 will fool current owners and penalize future owners
with higher fees and inadequate maintenance.


Note : click on images to enlarge.

Bookmark and Share

Spreadsheets, Charts and Graphs - An Aid to the Board in Making Better Decisions
This is one in a series of posts about how spread sheets which can then produce charts and graphs are very helpful when boards need to make financial decisions.  This is particularly true with delinquencies, budgets, bid reviews and Replacement Fund studies and decisions.

Not all board members agreed about this when I was a board member for eight years. In fact, one very long serving member insisted that she "could run this place with a columnar pad" and in the past the board did.  However, those boards also raised fees relentlessly and continued to vote for fee increases even when the numbers indicated a large surplus existed for the prior year (see the 2019 budget).

This post looks at Operations and Maintenance (O&M) budgets. These are short-term budgets for a single year.  The O&M budget is separate and distinct from the Replacement Fund (reserves) budget.

The following chart compares O&M approved budgets to O&M year end projections for several years.  As you can see, the budgets generally increased each year.  However, the projected year end surpluses increased as the expenditures decreased.  That was not an accident.

Boards must be cautious, and sometimes first glances at data can result in poor decisions.  There is a lot of information and board decisions behind the graphs below.   An analysis of the categories of the budget each year in October-November provided insights into why there was a difference between Approved (designed)  and Projected Year-End budgets.  In some years, the approved budgets were too large or small.  That knowledge was used to make adjustments when determining the budget for the next year. However, a board member should be careful to do the work to determine why and how approved budgets deviate from the projected year-end budgets.  As a board member I did not allow a single problem or issue sway the design for the following year.  For example, a large snowfall season (ice and/or snow) can have a significant impact on the expenditures for that category in one year. A spike in water bills certainly warrants a careful determination of how and why. So too if the Grounds Maintenance expenditures were larger than anticipated.

Not all board members do the analysis required and some merely argue for higher annual fees; i.e., increase the budgets by 3% or so each year.  It may be tempting to use inflation as a guide or justification. But the CPI-U is not useful for determining a HOA O&M budget increase or decrease.   

Changes in contracts, utility price hikes, anticipated weather patterns, and so on are useful for determining future budgets.

At BLMH we did repairs 2011-2018 which were intended to not only maintain the association, but to also decrease the annual O&M expenditures.  Improving efficiencies is one way, stopping waste is another.  Doing meaningful and long term repairs is another. Such repairs can reduce the maintenance hours spent each year. Maintenance  hours come out of the O&M budget. Similarly, landscaping improvements such as transitioning from decorative wood chips to stone can reduce annual O&M expenditures by $20,000 or more, if it reduces the annual cost of chips, reduces flooding and maintenance around buildings.  I've published lists of maintenance and projects which were intended to have long term benefits while reducing annual costs, with no reduction in services, etc.  


O&M Budgets - Approved budget compared to actual (projected year end)


Next is the same chart shown above, but with trend lines added.  The trend lines indicate something interesting.  The black line is the approved budget designed each fall. The red line is the expenditures projected for the year, as determined about a year later, after much of the year had passed.  Comparing the two is something that the board should do when determining the budget for the next year.  The board should also question any anomalies.  I did, but not all board members do. 

In the chart, the black trend line is the approved budgets ········ . That trend line indicates that annual O&M Approved Budgets increased by about 13.64% over a 7 year period. That's an increase of about 1.95% each year.

The red trend line for the projected year-end budgets ········  indicates actual annual expenditures increased 2.29% over a 7 year period. That's an increase of 0.33% each year. 

If we compare the approved to the projected year end O&M budgets it seems a surplus occurred.

During the period 2011-2018 the board Approved O&M budgets collected $7,214,060 via owner fees. (Note 3).  That was about $256,186 more than was spent.  (Note 2).  Such a difference between budget and actual is a surplus, which normally flows into the Replacement Fund as reserves.  I've included a summary for boards of the seven year period 2004-2010 (Note 4).

Interestingly, some board members will conveniently ignore surpluses when arguing for a fee increase during the budget process.  In the fall of 2018 with my departure from the board, the president promoted and the board unanimously voted for a 1.88% annual fee increase. The budget and projected year-end numbers indicated a large surplus. (Note 1). but some board members are never deterred by the facts.


O&M Budgets - with Trend Lines added  
trend lines are dots  ········
Scale is important.  Altering the x-axis, which in the chart above is dollars, amplifies, or exaggerates differences, making these more apparent.  It can also distort perception.  Below is the same chart, but with a different x-axis scale.


Operations & Maintenance Budgets - 2011-2020
I created a series of spreadsheets as an owner and later as a member of the board to monitor and compare changes in the O&M budgets. It included approved budgets and projected year end numbers. These were gleaned from the financial information the board released to owners during the budget approval process.  

The next chart is one. It provides and indicator of how designed budgets actually performed, and of the trends in rising or falling O&M costs.  You will note that budgets stabilized as better financial controls were implemented by the boards. 

Projected O&M budgets 2011-2004
My spreadsheet as an owner and not a board member

Next are a several charts I created as an owner, before I was elected to the board in the fall of 2010. I would update these each year after the board released the "official" annual budget to owners. 

I didn't achieve a board position until September 2010 (Note 1):

Percent Change in O&M Budgets, year by year 2004-2011


O&M Budget Graph
Change year by year, in percent 2004-2011


Here's a comparative graph I created in November 2011 and a table. This provided two things for the board. 

  1. An indicator of the magnitude of various O&M bills.
  2. A comparison of two years.


I produced the following pie chart presented to the board during an association meeting. They liked it, and it was put in the association Newsletter. This led to other spreadsheets, charts and graphs:

Budget pie-chart produced 2011 and put in the Association Newsletter
 
Here's a comparative graph I created in November 2011 and a table. This provided two things for the board. 
 

 Notes:

1. A cabal of owners did their best to keep me off the board, even chanting "Norm will raise your fees".  That worked for a year or so.  Fear is a powerful motivator, particularly in the midst of a banking crises and deep recession.  The cabal succeeded until September 2010.  Even after I achieved a board position, one individual persisted and issued an email telling select owners that "Norm is dangerous".  It took a letter from my attorney to put an end to that nonsense.  The lawyer and letter was paid for at my expense, of course. Those owners were wrong, which makes one wonder why they were so dead-set on keeping me off the board.  One possibility is that some owners wanted to keep their friends on the board.  Did I raise fees? Here's a table with the fee reality.  Pay particular attention to the fees from 2011 until 2018, when I was a board member, and compare them to the years prior and to 2019: 

2. Actual annual budget surpluses or deficits are determined via audit. However, audits are completed months after a new budget is created and approved. For example, the budget for 2018 was created in October-December 2017.  The projected O&M expenditures were determined about a year later, in September-October 2018.  The audit was completed and reviewed by Management and the Board in 2019.  That audit for the calendar year ending December 31, 2018 was dated September 19, 2019 by the accounting firm that prepared it.   I know this because I requested a copy and after months of delays my threat to get an attorney involved, the board finally relinquished and gave me a copy. 

 3. Owner fees contributed these amounts in the seven year period 2011 through 2018:

    • Replacement Fund (Reserves):  $3,270,920
    • Operations and Maintenance (O&M):   $7,214,060
    • A portion of O&M was identified as a surplus: $256,186 (Note 2).
    • Fines and late fees contributed additional amounts. 
    • The O&M budget was about 69% of the total over the period 2011-2018.  

           4. Budgets for the seven year period 2004 through 2010. I provide this for comparison purposes to the budgets in Note 3.:

    • Total to Replacement Fund (Reserves):  $1,816,915
    • Total to Operations and Maintenance (O&M):   $6,435,701.
    • Total Estimated portion of the O&M identified as a surplus: $66,238 (Note 2).
    • The O&M budget was about 87% of the total combined budgets over the period 2004-2010 (Replacement fund + O&M budgets). 

(c) N. Retzke 2021